AnnotationContext
The AnnotationContext provides additional information on how to display entities.
Entities can use ClassIds and KeypointIds to provide annotations, and
the labels and colors will be looked up in the appropriate
AnnotationContext. We use the first annotation context we find in the
path-hierarchy when searching up through the ancestors of a given entity
path.
Components components
Required: AnnotationContext
Shown in shown-in
API reference links api-reference-links
- 🌊 C++ API docs for
AnnotationContext - 🐍 Python API docs for
AnnotationContext - 🦀 Rust API docs for
AnnotationContext
Examples examples
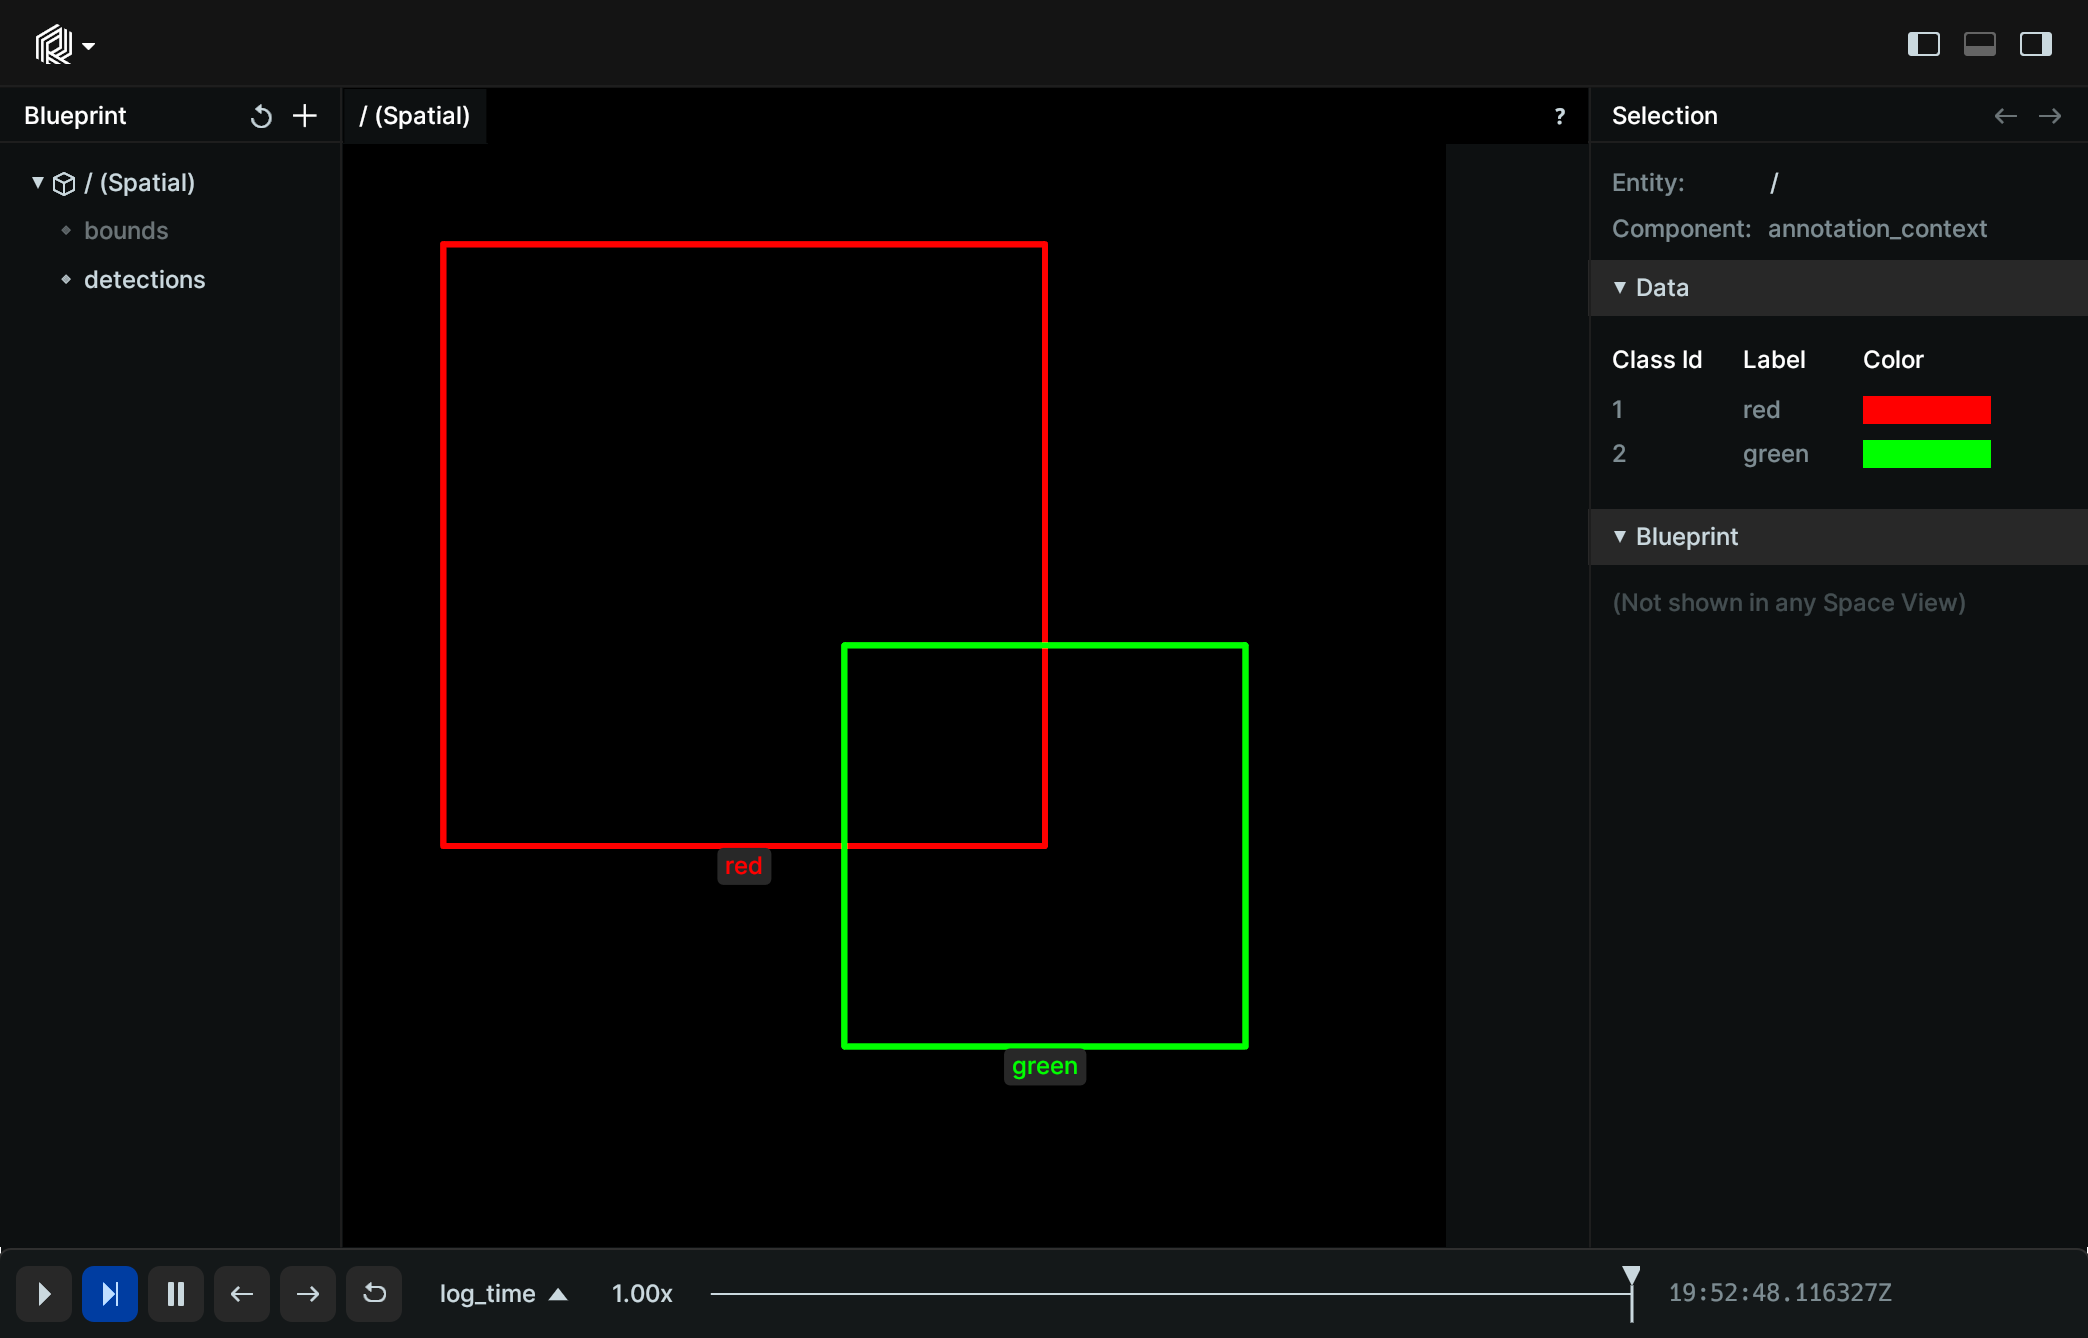
Rectangles rectangles
import rerun as rr

rr.init("rerun_example_annotation_context_rects", spawn=True)

# Log an annotation context to assign a label and color to each class
rr.log("/", rr.AnnotationContext([(1, "red", (255, 0, 0)), (2, "green", (0, 255, 0))]), static=True)

# Log a batch of 2 rectangles with different `class_ids`
rr.log("detections", rr.Boxes2D(mins=[[-2, -2], [0, 0]], sizes=[[3, 3], [2, 2]], class_ids=[1, 2]))
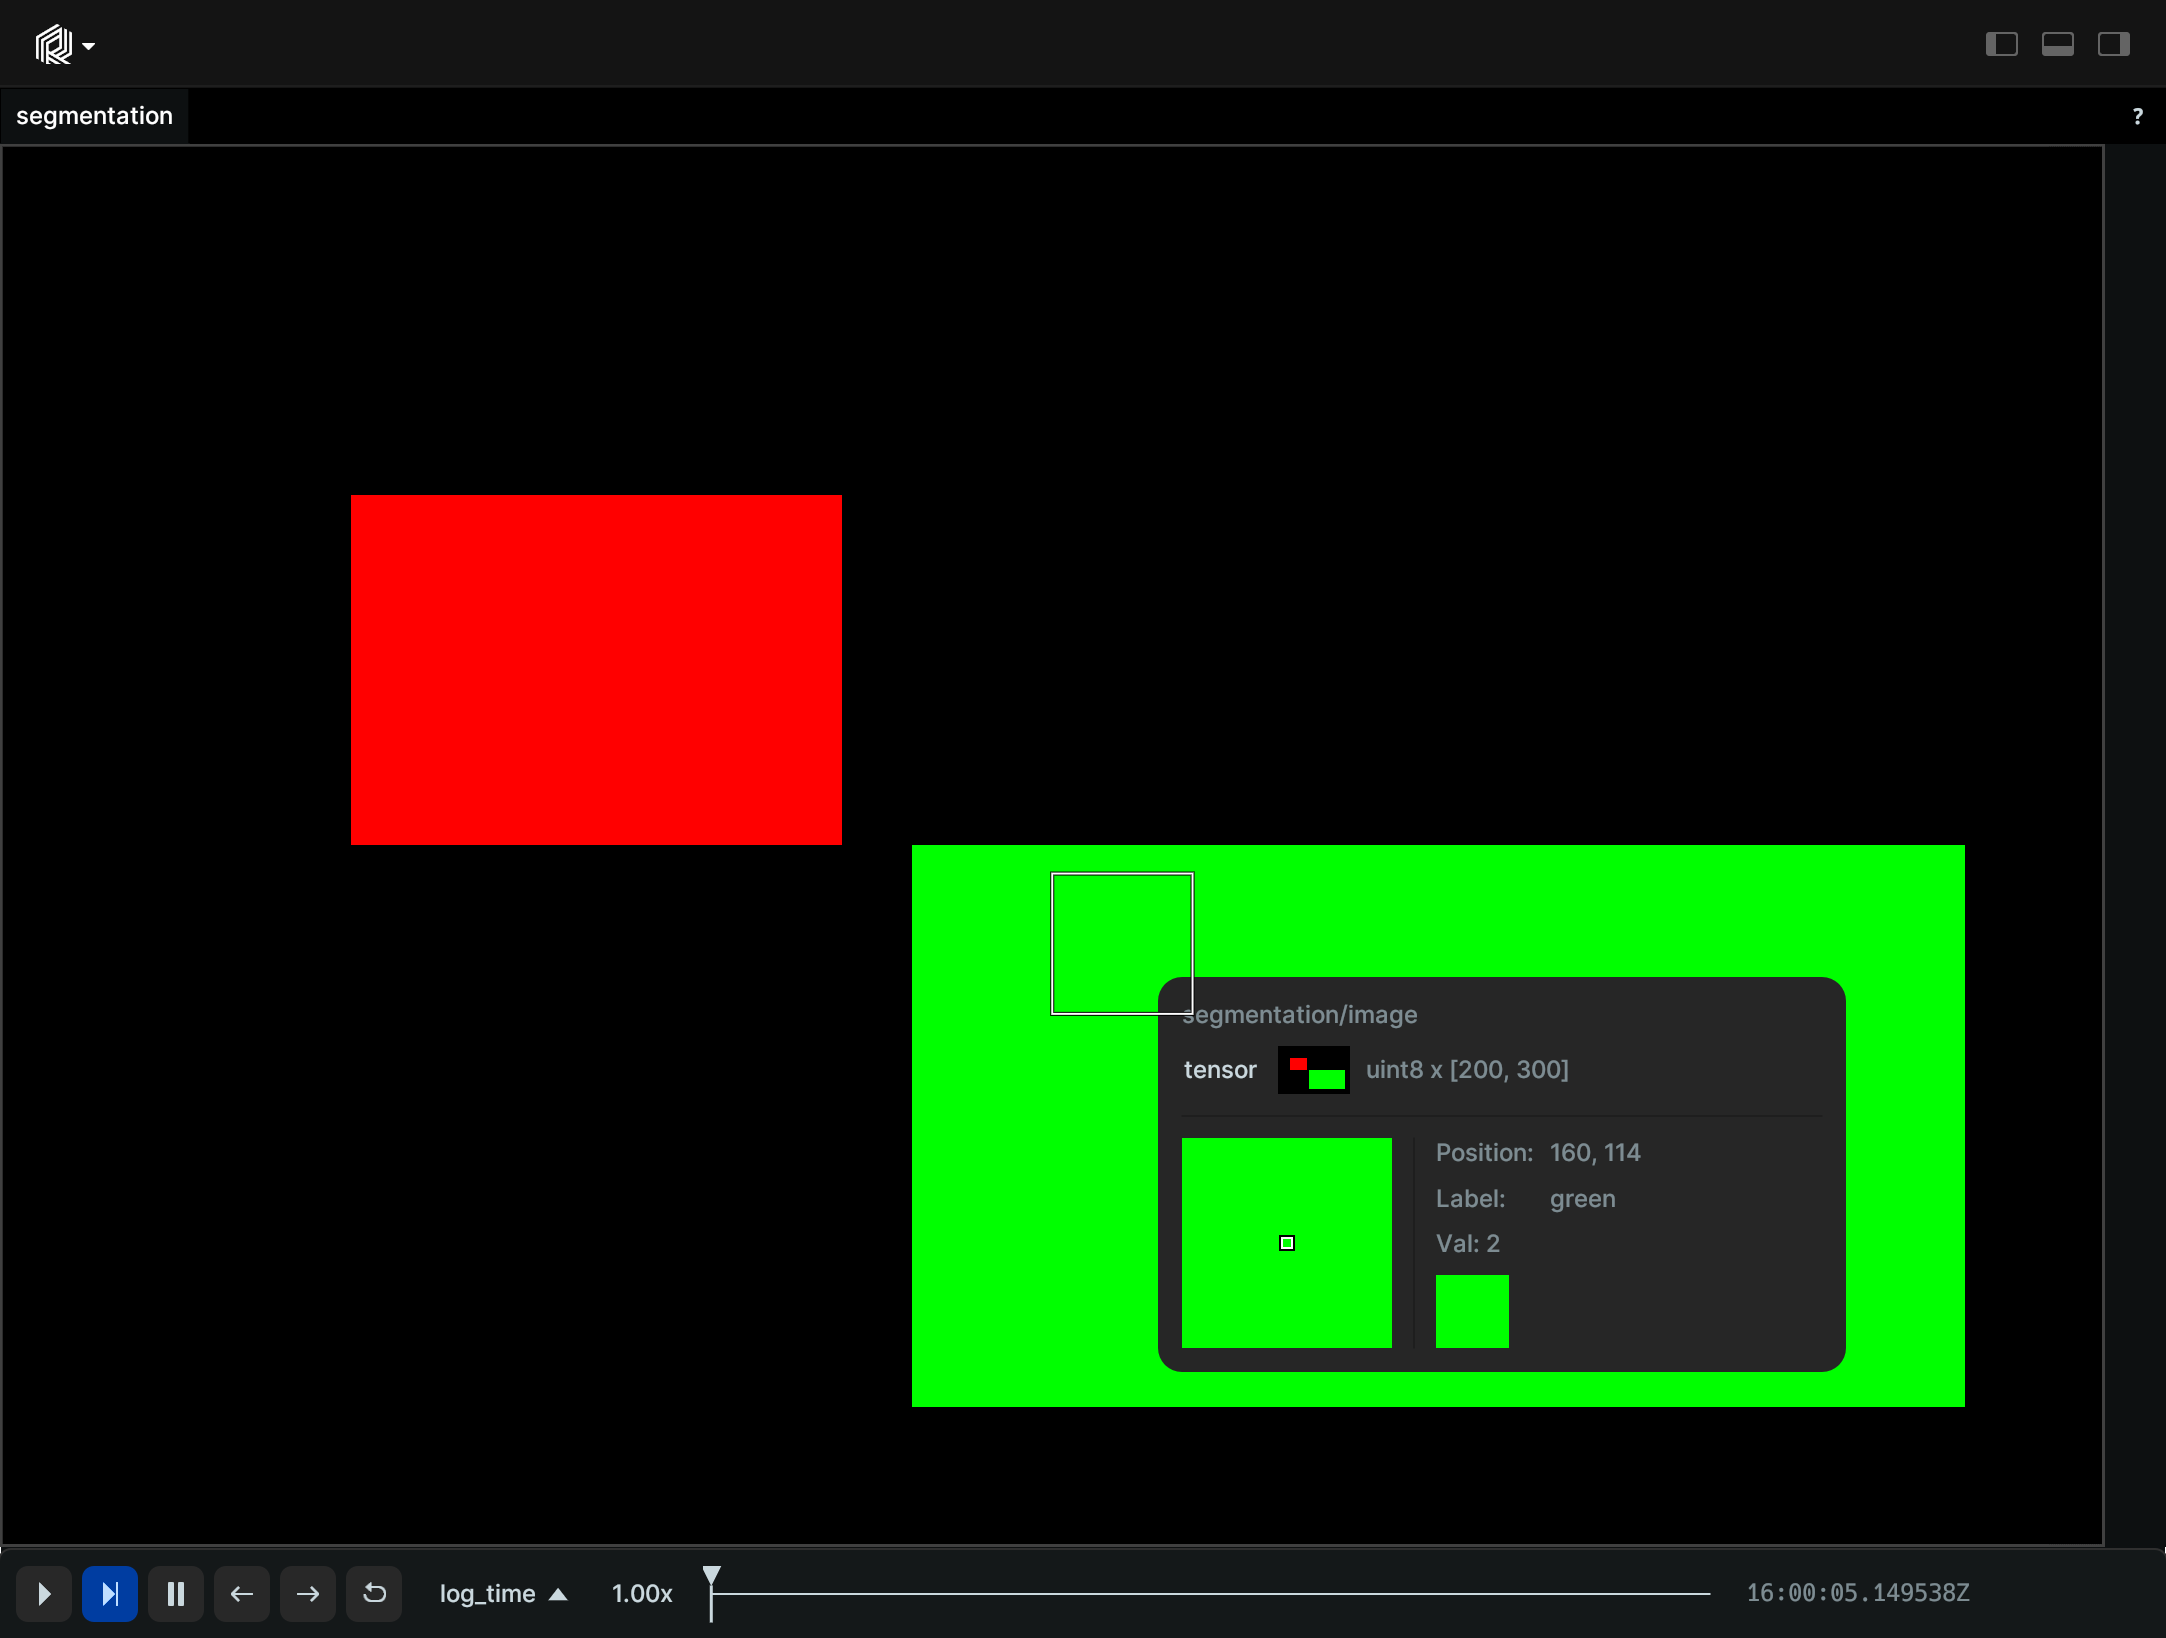
Segmentation segmentation
"""Log a segmentation image with annotations."""

import numpy as np
import rerun as rr

rr.init("rerun_example_annotation_context_segmentation", spawn=True)

# Create a simple segmentation image
image = np.zeros((200, 300), dtype=np.uint8)
image[50:100, 50:120] = 1
image[100:180, 130:280] = 2

# Log an annotation context to assign a label and color to each class
rr.log("segmentation", rr.AnnotationContext([(1, "red", (255, 0, 0)), (2, "green", (0, 255, 0))]), static=True)

rr.log("segmentation/image", rr.SegmentationImage(image))
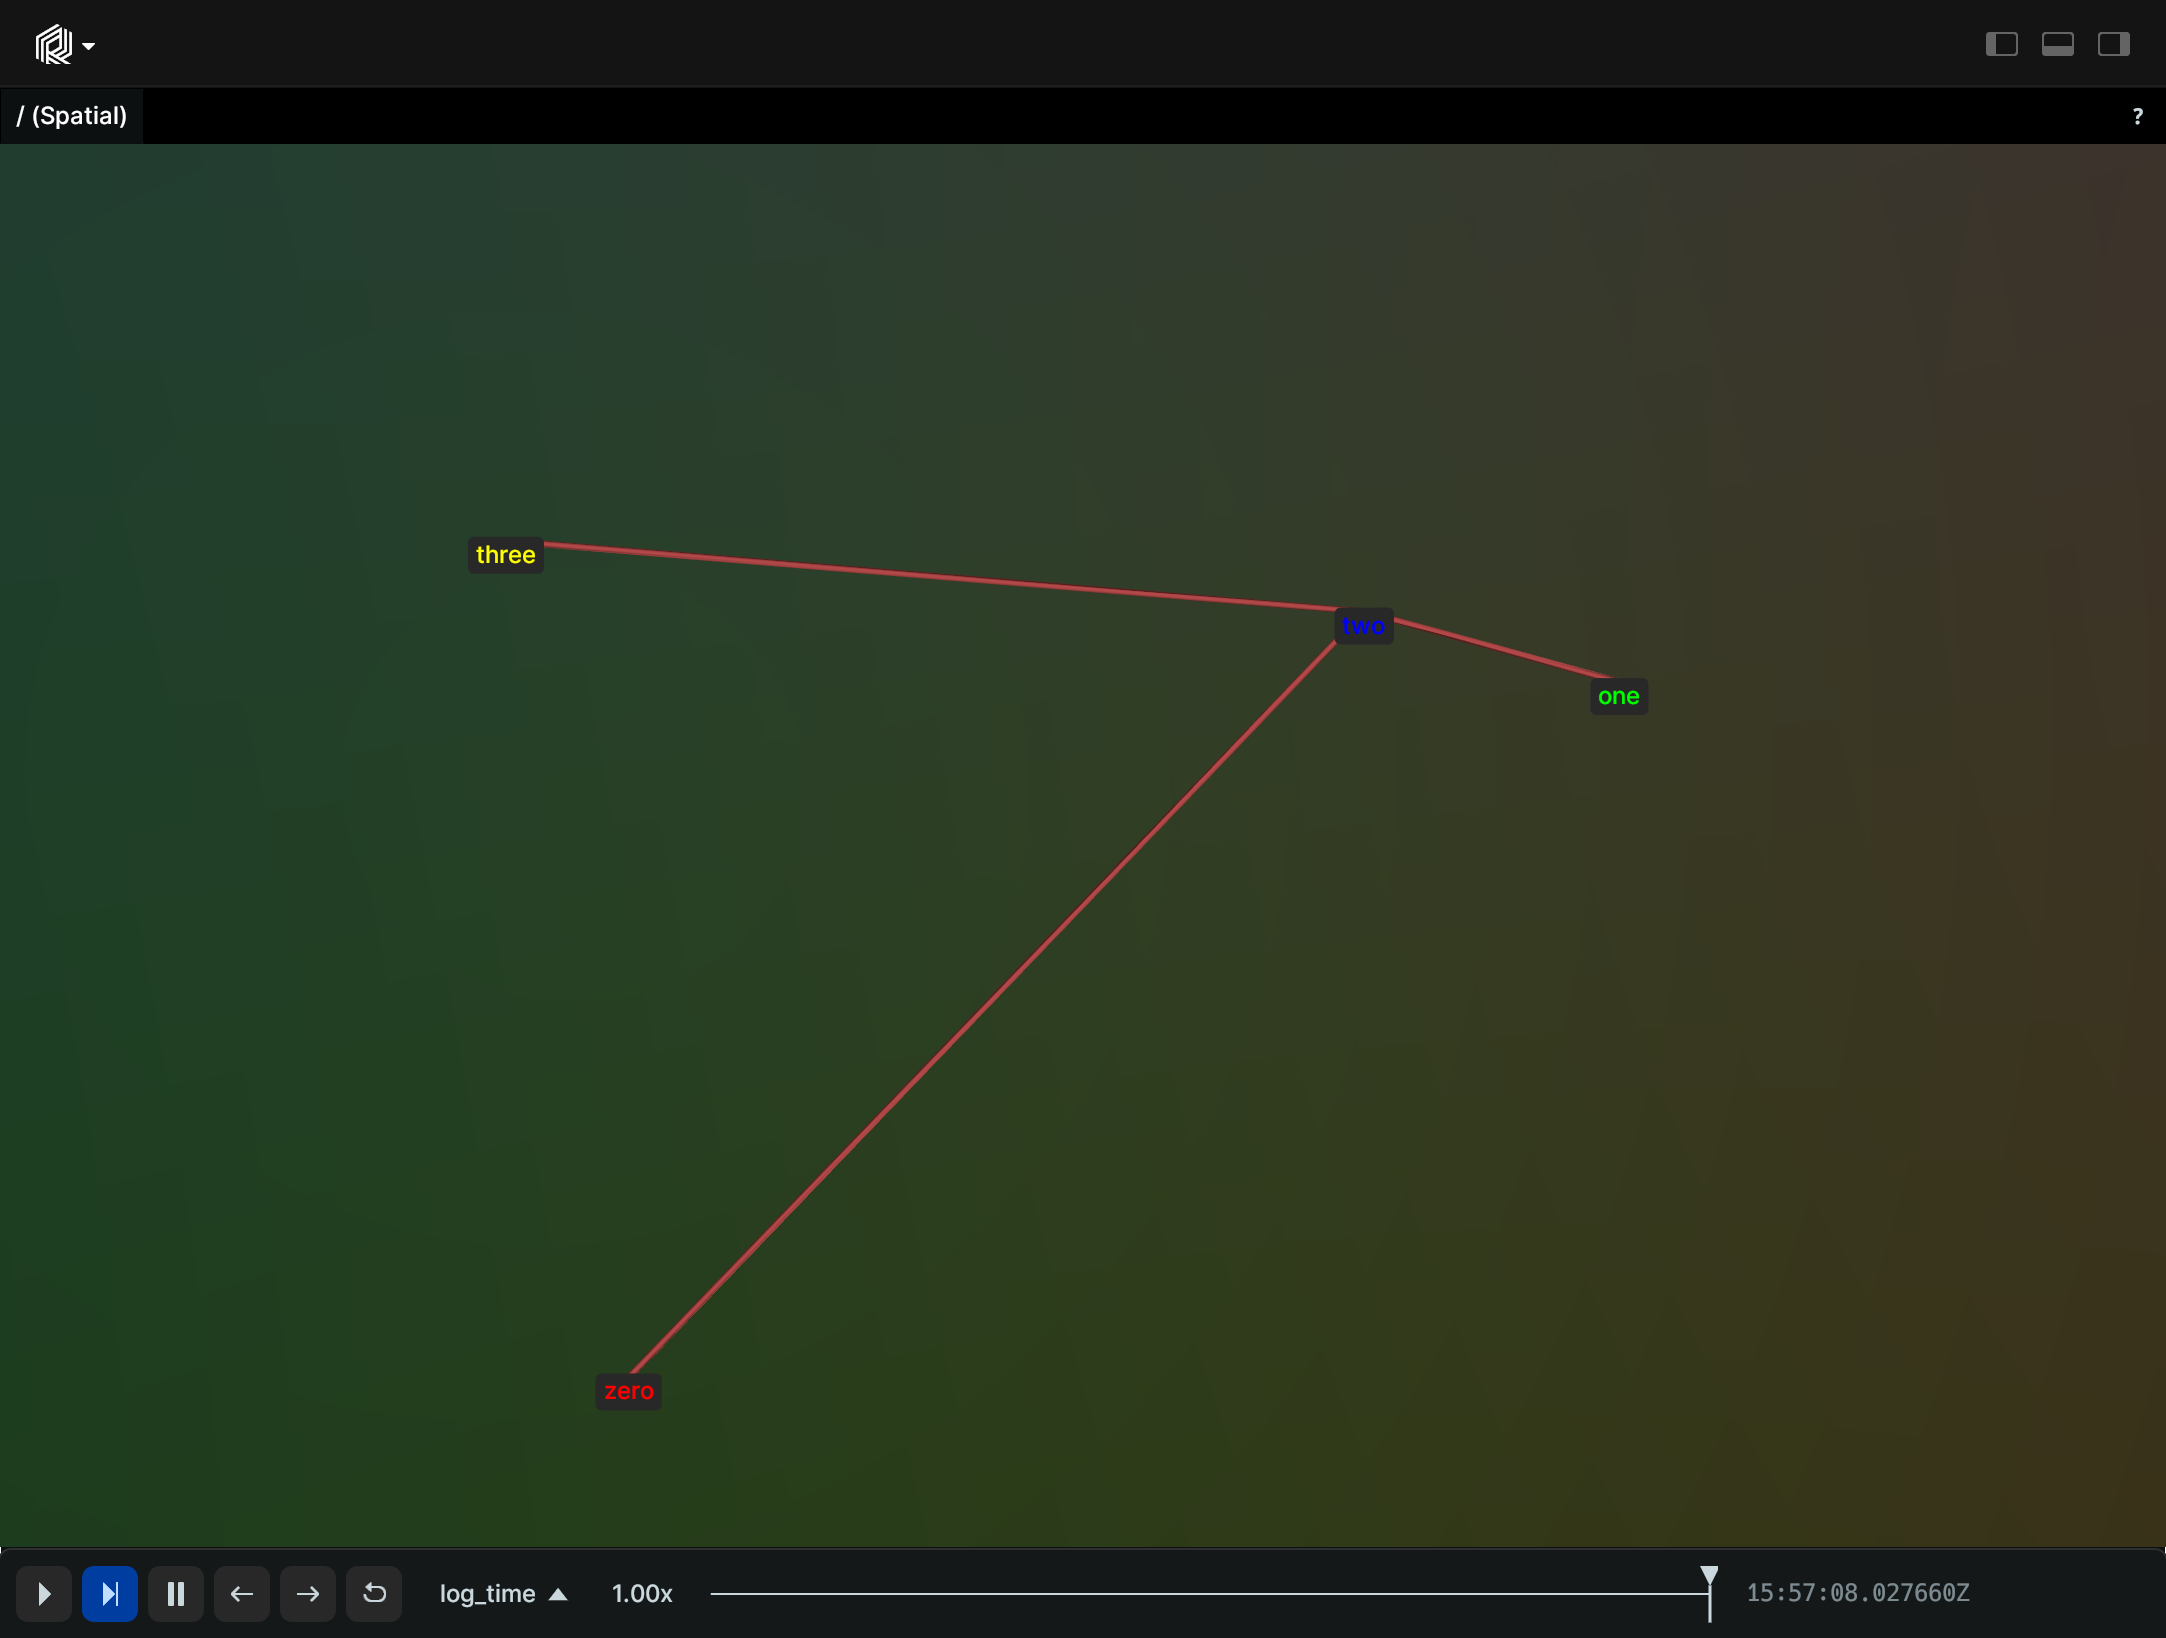
Connections connections
"""Log annotation context with connections between keypoints."""

import rerun as rr
from rerun.datatypes import ClassDescription

rr.init("rerun_example_annotation_context_connections", spawn=True)

rr.log(
    "/",
    rr.AnnotationContext([
        ClassDescription(
            info=0,
            keypoint_annotations=[
                (0, "zero", (255, 0, 0)),
                (1, "one", (0, 255, 0)),
                (2, "two", (0, 0, 255)),
                (3, "three", (255, 255, 0)),
            ],
            keypoint_connections=[(0, 2), (1, 2), (2, 3)],
        )
    ]),
    static=True,
)

rr.log(
    "points",
    rr.Points3D(
        [
            (0, 0, 0),
            (50, 0, 20),
            (100, 100, 30),
            (0, 50, 40),
        ],
        class_ids=[0],
        keypoint_ids=[0, 1, 2, 3],
    ),
)